
By Drew Lehe, Data Scientist, Data Surge
Graph Data Science is a cutting-edge field which applies graph theory to solve many data-related problems in the business world. Traditionally, graph theory is used heavily in computer science (to design algorithms), and a subfield of mathematics called probability (to model series of events). In Data Surge’s case, we employ graph analytics to improve entity resolution for clients. The goal of entity resolution is to evaluate how strongly connected (or disconnected) two records are to each other and decide if they’re part of the same entity, despite differences in how they are described or if data is entered inconsistently. It typically involves matching records from multiple data sources to ensure each ID is distinguished without error. Error-free databases ensure businesspeople and customers use products reliably, quickly and without confusion; entity resolution keeps software and analytics systems running smoothly.
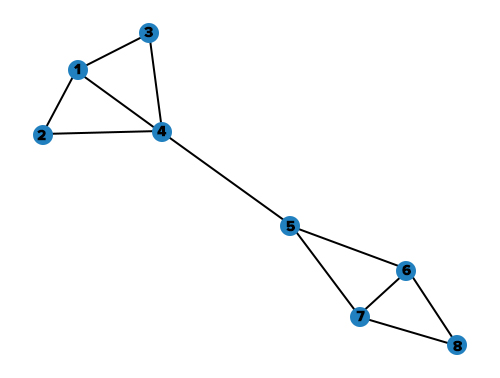
Figure 1. A typical graph encountered in Graph Theory.
In the world of entity resolution, graph data science (GDS) is often used to help uncover these discrepancies. It’s used to find connections between points (or nodes) in a network. This makes GDS ideal for entity resolution because it helps evaluate how strongly connected (or disconnected) two records are to each other and determine if they’re part of the same entity.
GDS depends upon graph algorithms, which are generally used for two tasks: linking and grouping. Linking determines whether two individual nodes are connected, whereas grouping determines if a set of linked nodes forms a community. The graph algorithms typically used for entity resolution are called “community detection” algorithms. Ergo, in graph terms, entity resolution is about creating error-free communities.
Solving a Business Problem with GDS
Data Surge recently helped solve an entity resolution issue for a client with billions of records pertaining to people. They needed a system which could reliably and cleanly match a group of records to a single person. The client was using a machine learning model and an arbitrary, rules-based matching method, but still combined some records erroneously; multiple people’s records were matched to the same ID. By adding GDS methods to their technology stack, we were able to eliminate the majority of erroneous matches in our test data. For best results, we find it’s often best to employ GDS methods in combination with a rules-based approach which taps into clients’ domain expertise.
Deploying Graph Tools
One of the most popular (and simplest) algorithms for GDS is Label Propagation. Its simplicity makes it widely available in popular Python packages including Neo4J, Scikit-Learn and in GraphFrames for PySpark. With label propagation, a few points in a network are randomly assigned labels, then, as the algorithm iterates, it assigns each node the most common label of its immediate neighbors.
When preprocessing your data for a graph project, your labels will be the node identifiers, and graph algorithms will use one or more features to determine connections amongst the nodes. GDS packages will generally offer the ability to search your data for communities based on a feature or common motif (i.e. nodes with the first name “John” connected to nodes with the last name “Doe”). You may also query nodes according to their “degree” (the number of other nodes they are connected to) to find especially isolated or overloaded nodes, which may help identify weaknesses in your GDS deployment. Those are just a few of the many useful graph tools any data professional can access.
An example of GDS for Entity Resolution: Transitive Matching
Remember the graph in Figure 1 earlier? It was created from a sample set of records seen below in Figure 2. In our data, we have two individuals (Stephen Graphman and Stephanie Garrison), erroneously assumed to be one person by an inferior model which doesn’t employ graph methods.
| First Name | Last Name | Home State | Phone # | AssignedSystemID | |
| 1 | Stephen | Graphman | Maryland | (555) 555-5555 | 12345 |
| 2 | Stephen | Graphman | Maryland | 555-5555 | 12345 |
| 3 | Steve | Graphman | MD | (555) 555-5555 | 12345 |
| 4 | Stephen | G. | MD | (blank | 12345 |
| 5 | Steph | G. | MN | (blank | 12345 |
| 6 | Steph | Garrison | MN | (blank | 12345 |
| 7 | Stephanie | Garrison | MN | (444) 444-4444 | 12345 |
| 8 | Stephanie | Garrison | Minnesota | (444) 444-4444 | 12345 |
Figure 2. Sample Dataset
Assume the first entity resolution model gave all these records the same AssignedSystemID of ‘12345’. To start, the model correctly assigned records 1-4 to one community (the “Stephen Graphman community”), then correctly created a community from records 5-8 (the “Stephanie Garrison community”). But when it encountered records 4 and 5, it erroneously assumed both groups to be part of the same community because they share so many similar fields,.
Where GDS Offers Improvement Over Traditional Machine Learning Models
This type of error is unfortunately common among many ML models attempting entity resolution: it measured the string similarity between records 4 and 5, got a high score, and therefore assumed 4 and 5 referred to the same person. This mistake is nicknamed the “transitive matching error” because it resembles the transitive property in mathematics: if a = b and b = c, then a = c. The model assumed that, because one Stephen Graphman record resembled one Stephanie Garrison record, all records have the same identity (think of records 1-4 as “a”, 4-5 as “b”, and 5-8 as “c”).
Many machine learning models would create a “transitive” link for these two records because both have the same last name and phone number, similar state abbreviations, and similar first names. Even the similar phone numbers could befuddle many machine learning pipelines which use word distance, causing them to couple these people together. With graph analytics, though, we can examine each record’s relationship to the nodes around it to properly split the data into two communities.
Leveraging the same graph from Figure 1, but with names assigned to the nodes (Figure 3), in NetworkX, we can change the label of each node to any feature we’d like, as I’ve done below.
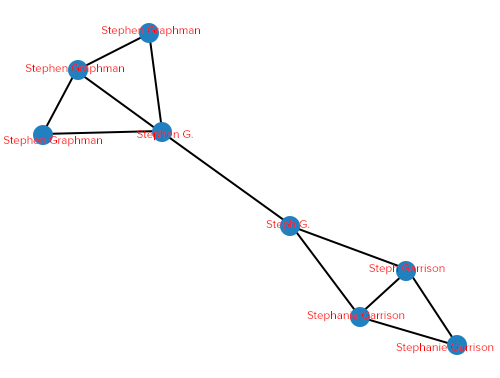
Figure 3. Each node is shown with its associated first and last name.
Graph tools can be fed the features of the model to determine links between records (or nodes) just like any machine learning tool. But what differentiates a graph tool from many traditional machine learning models is how it examines the relationships of the node to its surrounding nodes. Some aspects it would examine include:
- The number of connections from one node to other nodes
- Which nodes are pointing to a particular node (do a lot of nodes point to node A, which then points to node B? In that case, node A may also be influential or relevant to a specific community)
- The number of nodes one must traverse to reach another node
- Feature similarities shared by all nodes in a community
- How a community changes, on average, when one node is removed or added to a community
- Empirically, how often does a random walk on this graph from point A wind up at point B (or its neighbors)?
These different methodologies result in a clearer determination of communities. To illustrate, let’s run LPA on our sample data and see what it gives us:
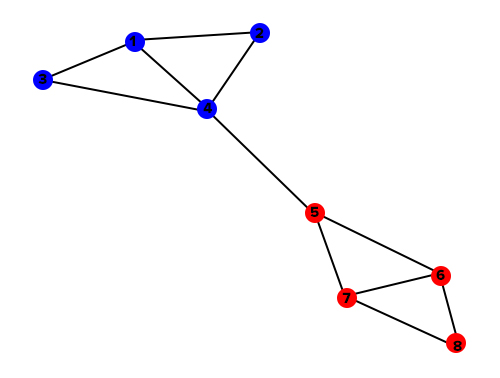
Figure 4. Dataset with LPA applied, assigning each node to a community.
Because LPA was able to look at the number of nodes pointing to each node, it was able to correctly identify two separate communities. DataSurge leveraged these same techniques to deliver significant accuracy gains for our client.
Potential Pitfalls of Graph Algorithms
No cutting-edge algorithm can be a panacea for all data problems, and GDS is not without its weaknesses. LPA may create more communities than necessary, leading to “false negatives” in the results (erroneously splitting records into multiple identities). But, in Data Surge’s case, this client was fine with an occasional false negative because there are multiple fields to search for a record. It was more convenient for them to split one person into multiple identities because they can always check multiple fields to make sure they have all that person’s records. In other words, it was never okay for multiple people to be attached to the same ID, but it was fine for one person to be attached to multiple IDs (on rare occasion). Needs vary from project to project; to adjust the rate of false negatives, users can lower or raise the requirements for joining nodes into a community, or determining if two nodes are connected.
Individually, most graph algorithms are computationally efficient. But with highly complex networks looking at multiple features, or if you change the parameters of the algorithm to run for hundreds of iterations, they can become costly.
The World of Graph Analytics
Graph Data Science has solved problems in several topics related to Entity Resolution as well, including:
- Creating customer segments to design marketing campaigns and personalized product experiences
- Analyzing relationships between social media accounts to detect spambots spreading misinformation
- Finding similar characteristics among bank accounts worldwide to identify fraudsters routing laundered money back to themselves or associates
- Identifying highly contagious patients so they may be isolated and limit the spread of illness
Ultimately, the effectiveness of Graph Data Science is limited only by your ability to frame a business problem in Graph Theory terms and format your data so that with GDS tools. Data Surge has developed a solutions accelerator for solving entity resolution issues using graph analytics, wherein we apply our GDS expertise to quickly and effectively deliver cleaner databases for our clients.